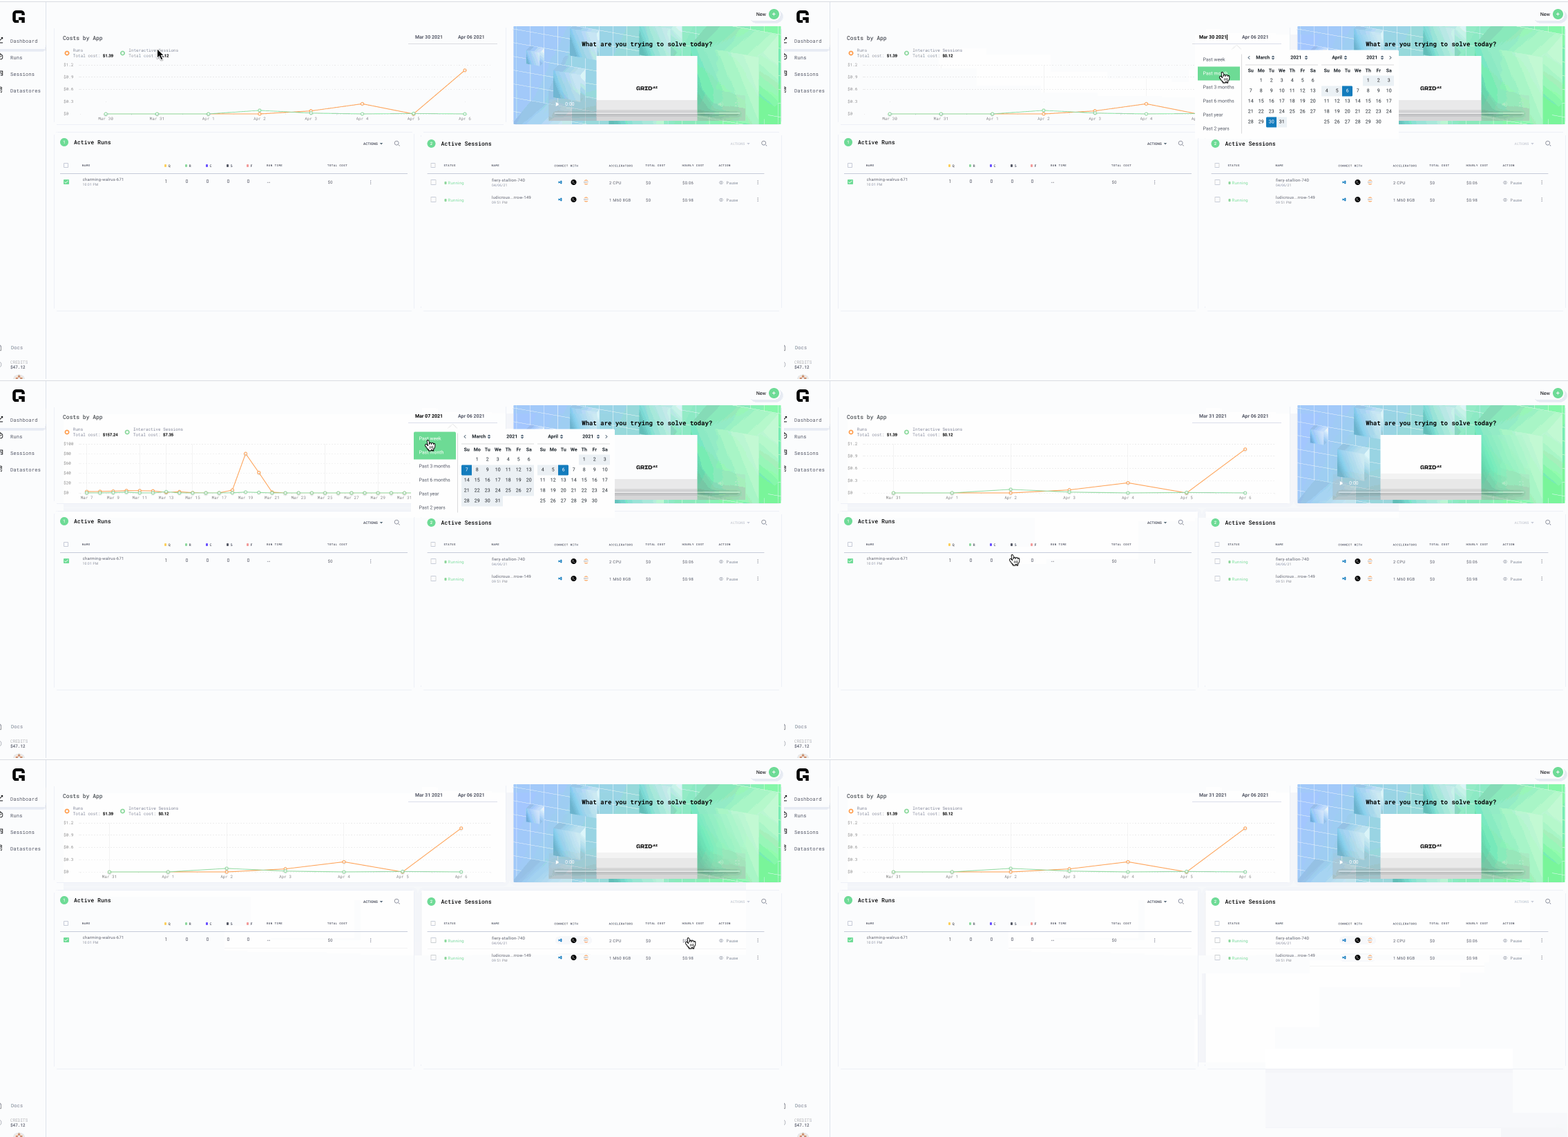
Keeping track of costs
Dashboard View
The dashboard page shows a graph of Runs and Sessions and associated costs. You can also see what is currently active.
note
All costs are estimates until Runs or Sessions are complete.
Runs and Sessions pages also show the cost per experiment and cost of each session; the dashboard is the easiest way to see the costs.

Low Balance Warning
If the balance goes below $10, Grid will warn you about "low balance remaining".

Zero balance will prompt a shut down of interactive sessions as well as active runs.